Scaling
How Wheels4Wheels can scale to more parameters, more cities, and more audiences.

Timeline
Wheels4Wheels has developed in four stages since 2024. From foundational research and building the pipeline, to validating the method in Tallinn and publishing data and tooling open-source. In it's fourth stage, with the method validated, the project focuses on widening features, expanding scope, and promoting adoption.
| Stage | Period | Goal | Details |
|---|---|---|---|
| Research & Development | 2024 | Develop methodology | Feasibility research Parameter selection Sensor evaluation and testing First version of the pipeline |
| Tallinn Pilot | 2025/26 | Validate method | 550 km covered across all Tallinn districts 40.5M accelerometer readings processed into 66,088 surface ratings Validated against existing OSM data and manual mapping Engaged with OSM community |
| Public Launch | 2026 | Gain public support | Full methodology and dataset published Processing pipeline released as open source Project introduced through media campaign Initiated conversations with map apps |
| Scaling | 2026/27 | Increase adoption | Implementation of more parameters Expand scope in Tallinn, add new cities Promote adoption of data by map apps |
Scaling Directions
The pilot in Tallinn demonstrated that e-scooter sensor data can reliably map accessibility features such as surface quality. That result validates the approach and opens three directions for scaling.
- More Parameters
- More Cities
- More Audiences
More Parameters
The pilot validated one parameter – surface quality. The same sensors and the same pipeline can capture more: surface type from vibration patterns, incline from gyroscope and GPS readings, and sidewalk features from onboard cameras. Each additional parameter can feed the Wheels4Wheels pipeline and result in standard OSM tags.
Surface Type
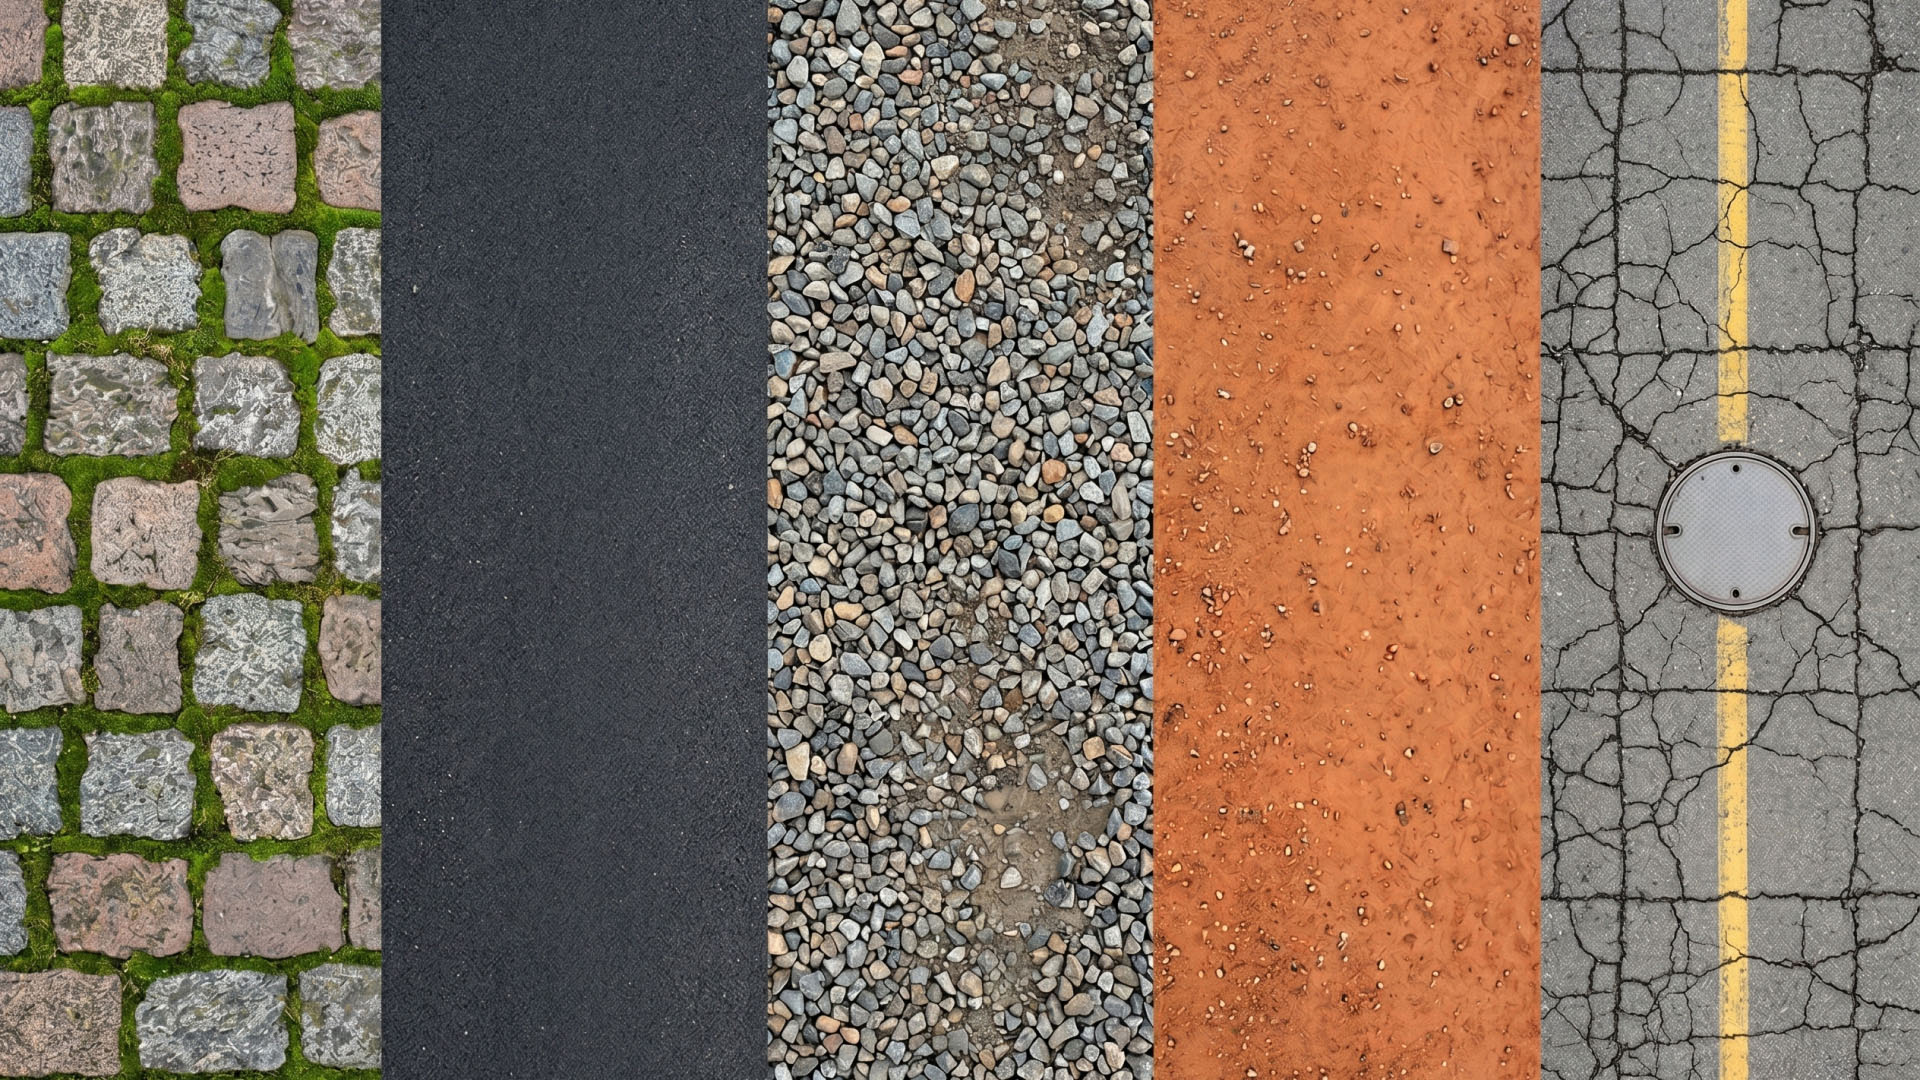
After surface quality, the next parameter is surface type: the accelerometer and gyroscope on Bolt scooters measure wheel vibrations and angular movements to identify pavement characteristics such as asphalt, cobblestone, concrete, or gravel. These readings are processed via the CLI to classify each street segment and automatically generate OSM-compatible surface=* tags.
Incline
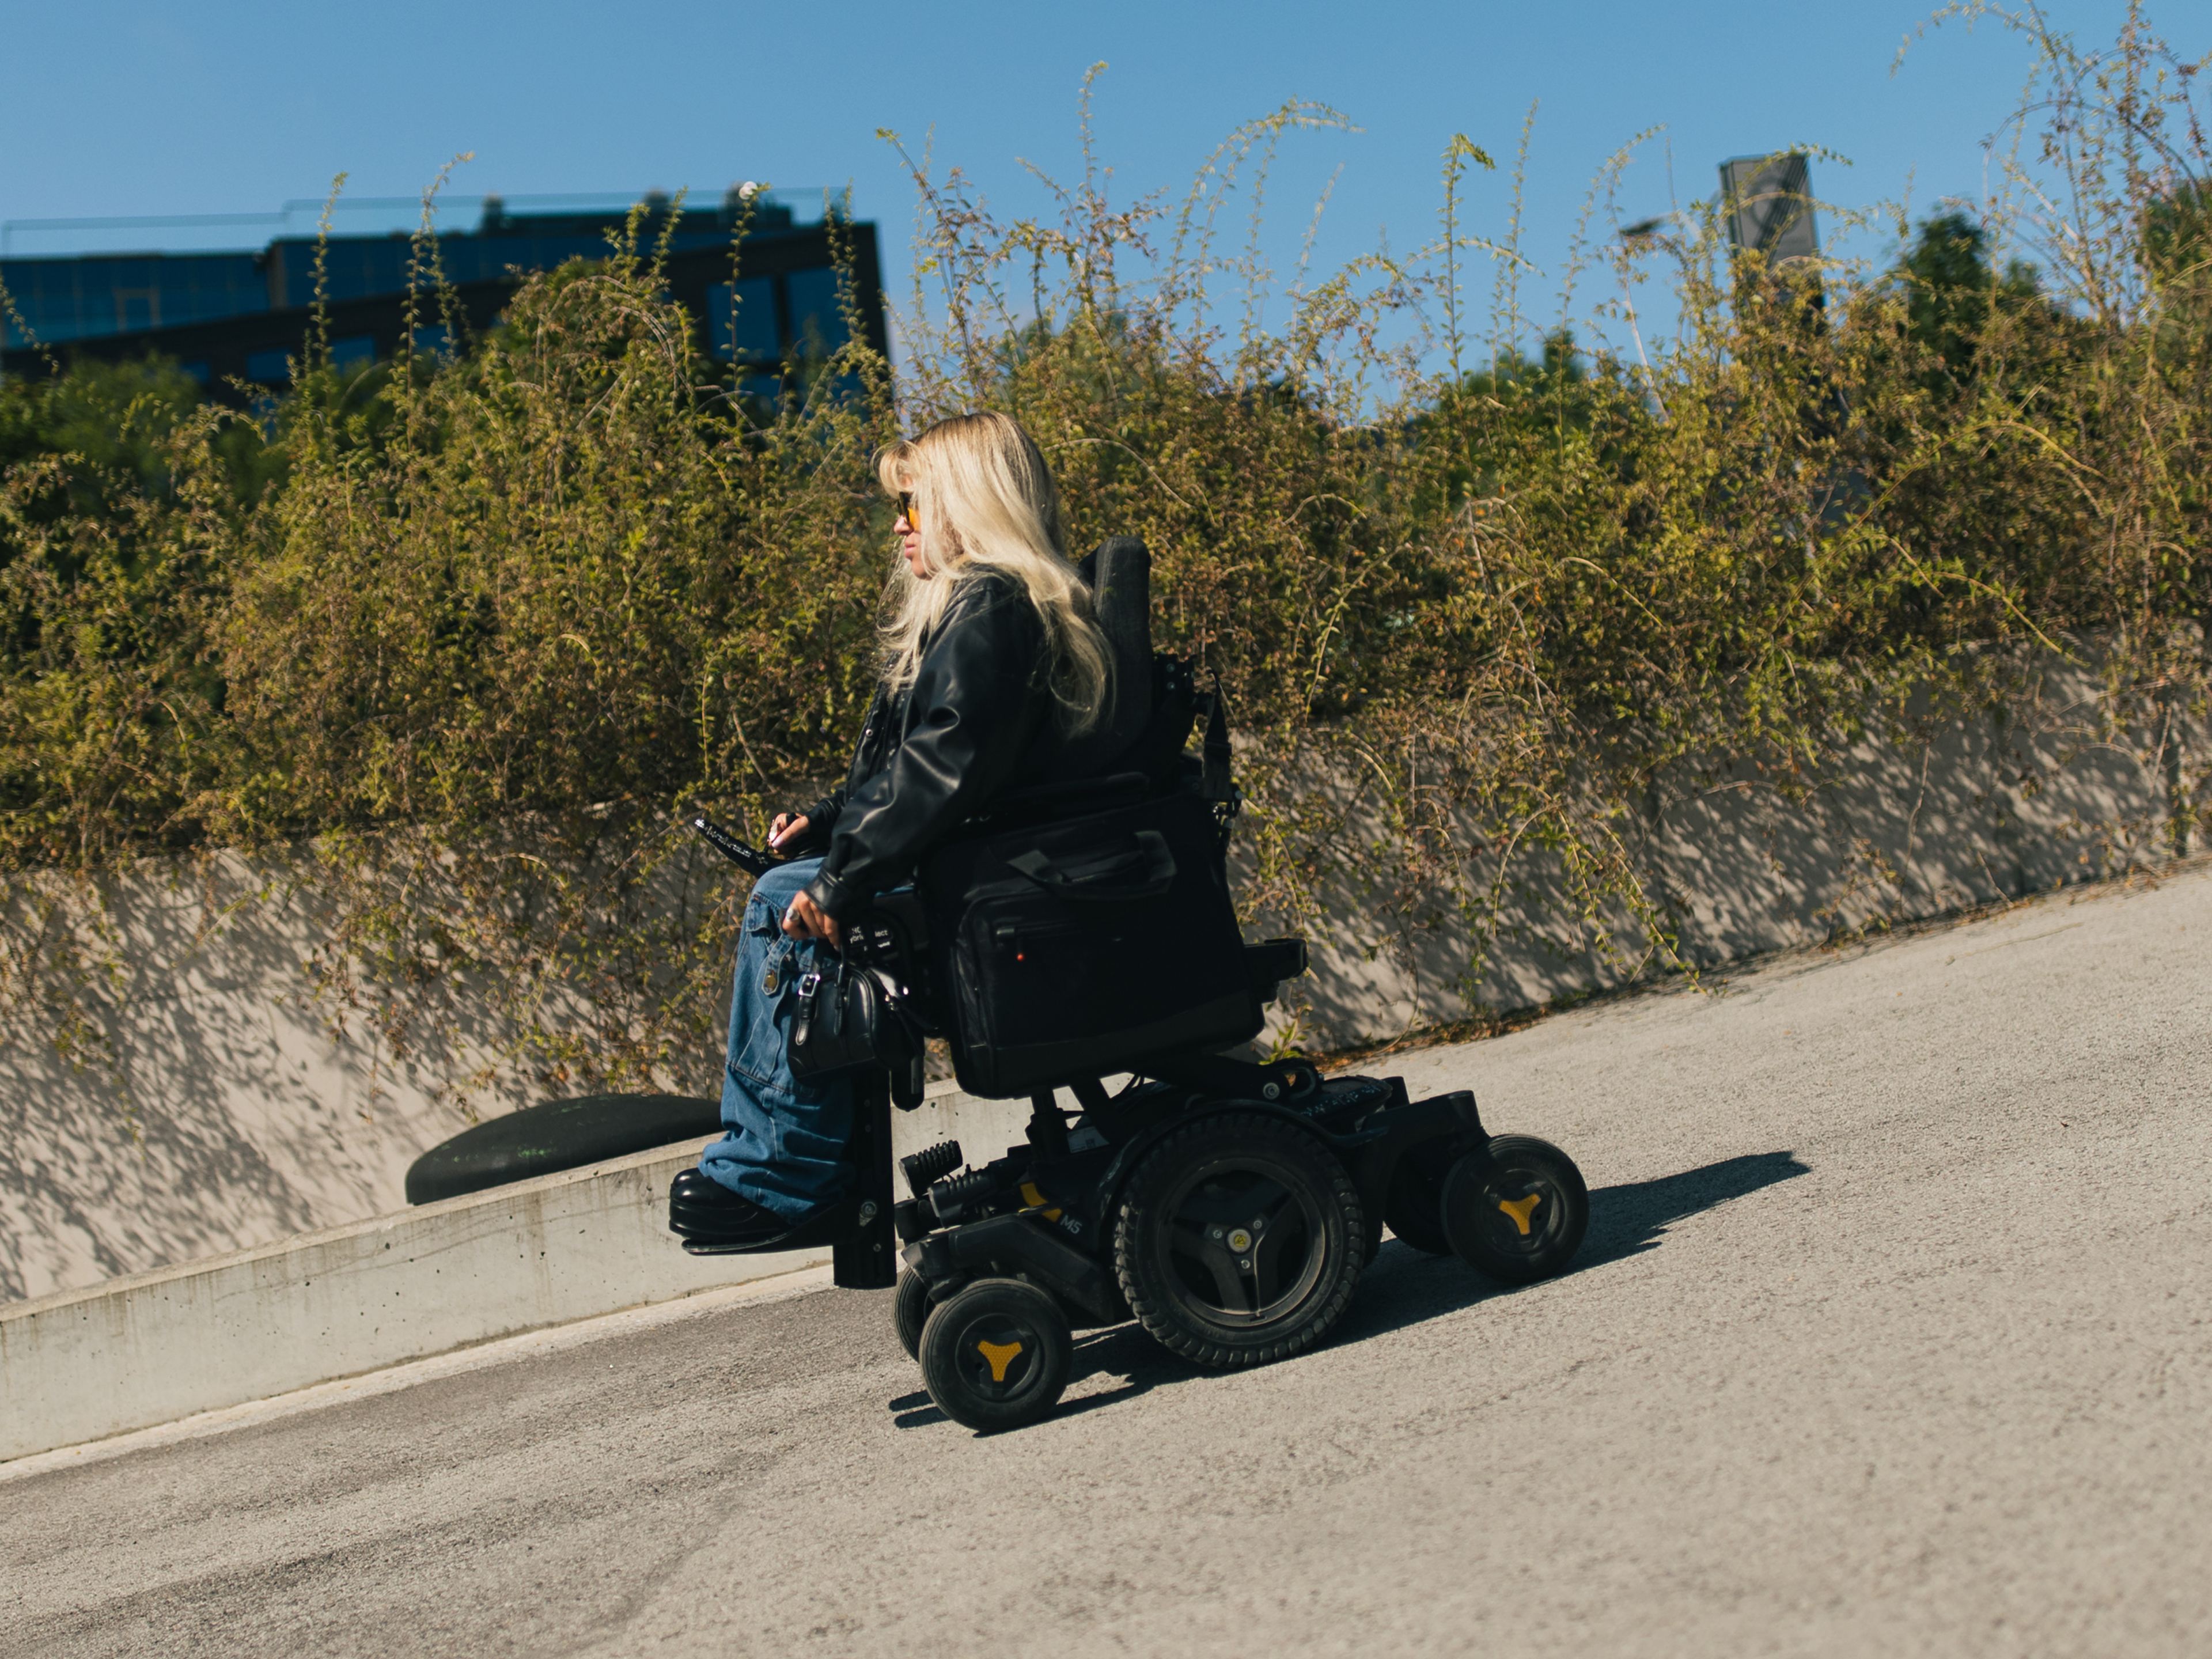
Incline is derived from the gyroscope and GPS data, capturing the slope of sidewalks, ramps, and streets. The CLI computes the average and maximum gradients for each segment and can assign the appropriate OSM-compatible incline=* or slope-related tags.

Sidewalks, Curbs, Ramps
Onboard cameras capture sidewalks, curbs, ramps, and barriers; GPS pins each image to a location. An AI-based detection pipeline can identify accessibility-relevant features in the images, the CLI can link them to specific street segments to generate or validate for example sidewalk=, barrier=, and wheelchair=* tags – a visual complement to the sensor measurements.

More Cities
Because Bolt already operates e-scooters in 270+ cities across Europe, the infrastructure is in place for Wheels4Wheels to be replicated at scale. Every city has its own transport mix, street conditions, and regulations; yet the same e-scooter telemetry sensors and app infrastructure can be deployed without additional hardware. Mapping a new city adds little overhead. Publishing the results to OpenStreetMap makes cities comparable and speeds up the rollout of accessible-route mapping.

More Audiences
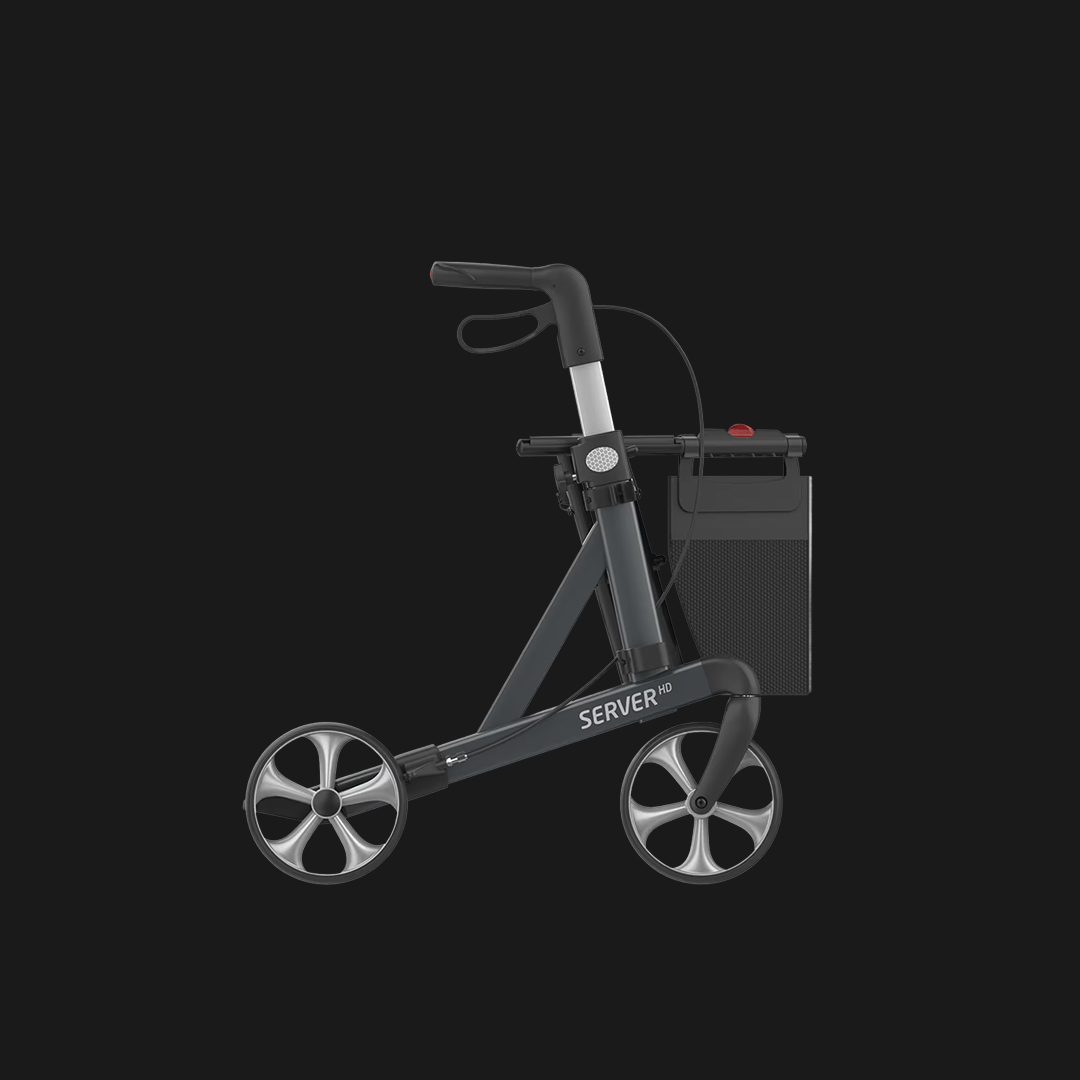
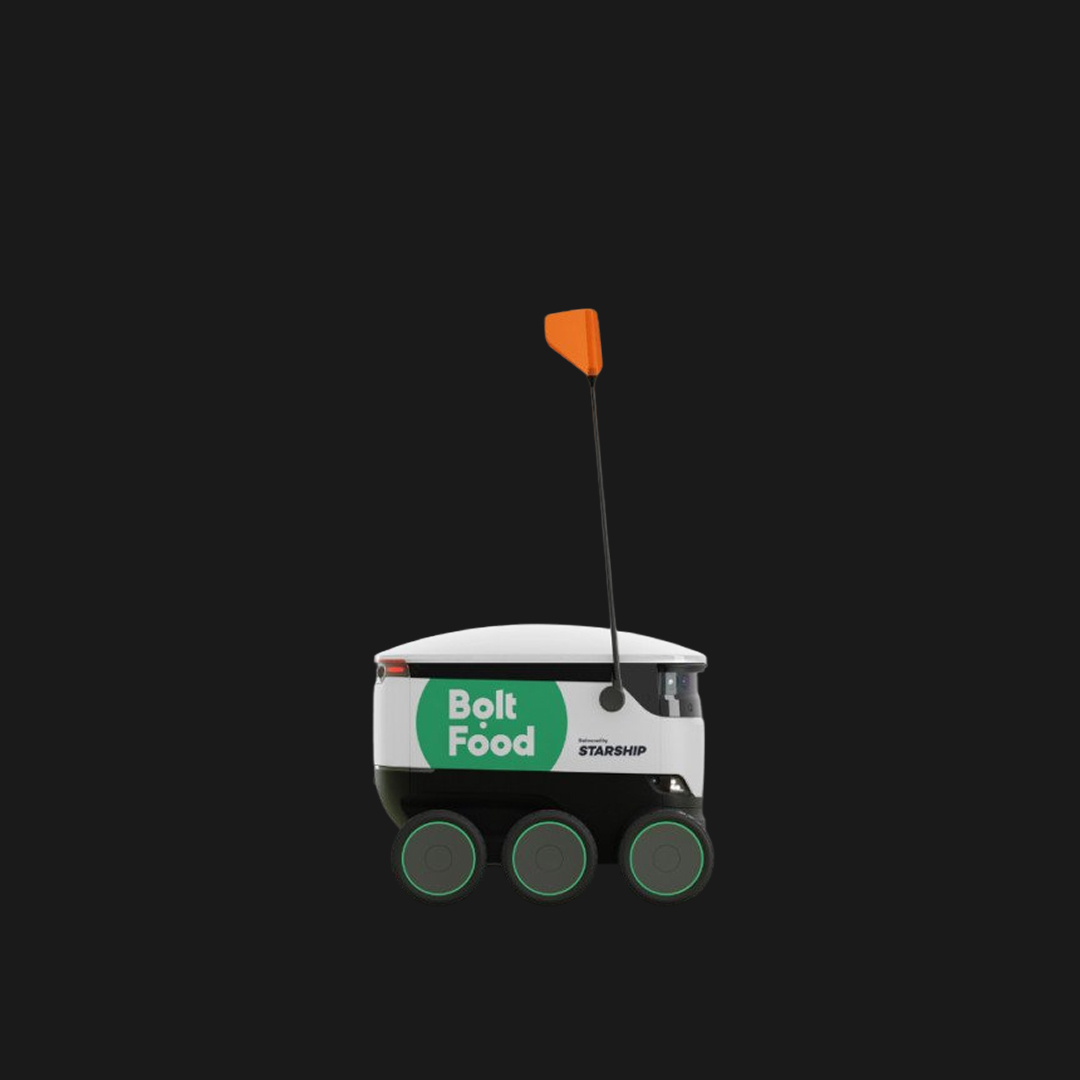
While the dataset is designed to benefit wheelchair users, it also supports people pushing strollers, older people using walkers, and others who rely on mobility aids. Looking ahead, the same data can help micro-mobility and even autonomous vehicles plan their routes. The pipeline is built to take on new vehicle types and use cases as they appear.